Last updated: April 17, 2026
Data for March 2026
This report analyzes the most serious crimes in Austin, Texas, as identified by the FBI’s Uniform Crime Reporting (UCR) program. These offenses represent the core metrics used nationally to assess public safety trends. To deliver the following visualizations and statistics, we collected raw data from the City of Austin’s official open data portal and updated monthly to provide current insights into local crime patterns.
Total incidents: 2,372. Previous (February) was 1,869.
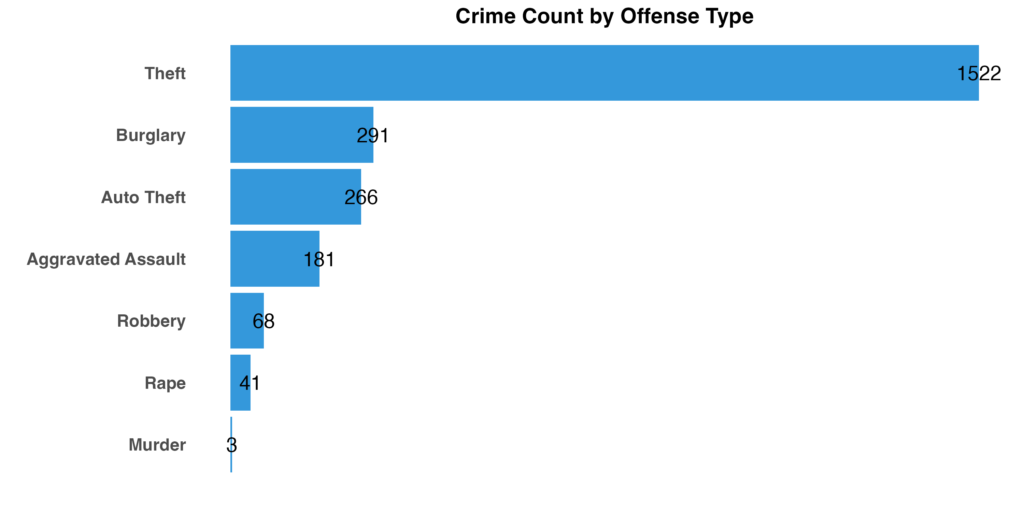
Crime Count by Offense Type
This chart shows the frequency of each major crime type reported during the period, based on FBI Uniform Crime Reporting classifications.
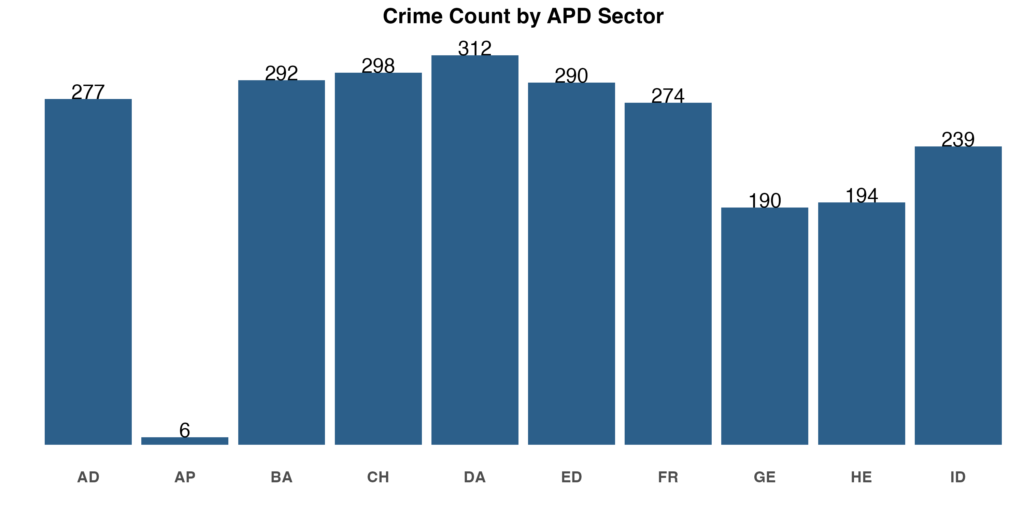
Crime Count by APD Sector
Austin Police Department divides the city into patrol sectors: Adam (AD), Baker (BA), Charlie (CH), David (DA), Edward (ED), Frank (FR), George (GE), Henry (HE), Ida (ID), and Airport (AP). These geographic divisions help APD manage resources and coordinate response across the city.
To identify which sector covers your address or zip code, refer to the APD sector map available on the City of Austin’s website.
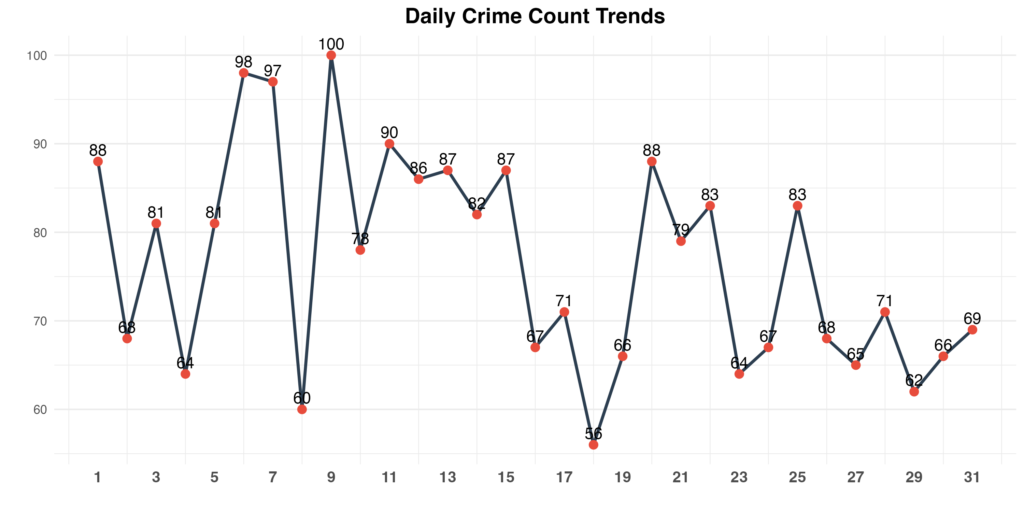
Daily Crime Count Trends
Crime occurrence varies throughout the month, with some days seeing higher activity than others. These daily trends can reveal patterns related to day of the week, local events, or environmental factors.
Tracking these fluctuations provides insight into when criminal activity tends to peak within the community.
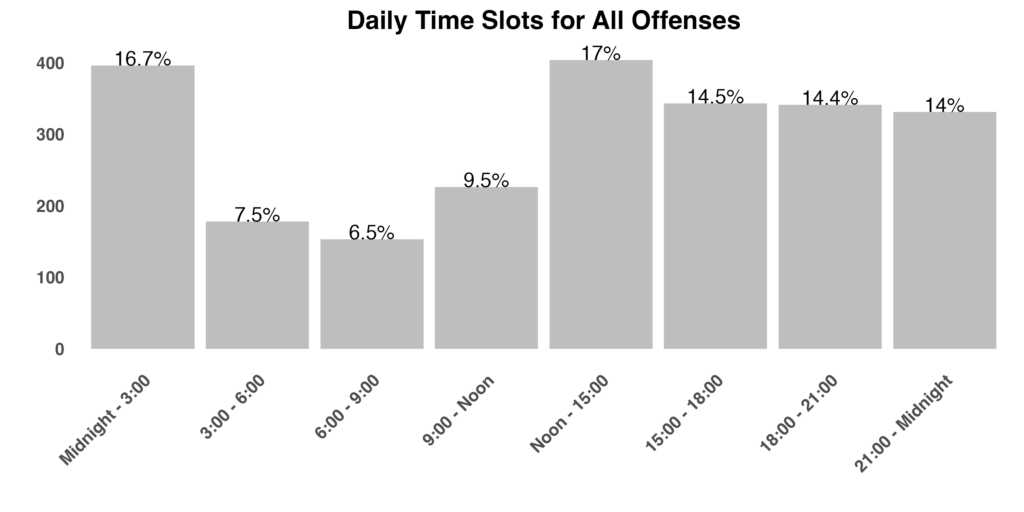
Crime Distribution by Time of Day
Time of day significantly influences crime occurrence. This chart divides the 24-hour period into segments, showing when crimes are most and least likely to be reported.
Recognizing these patterns provides insight into how criminal activity ebbs and flows throughout the typical day.
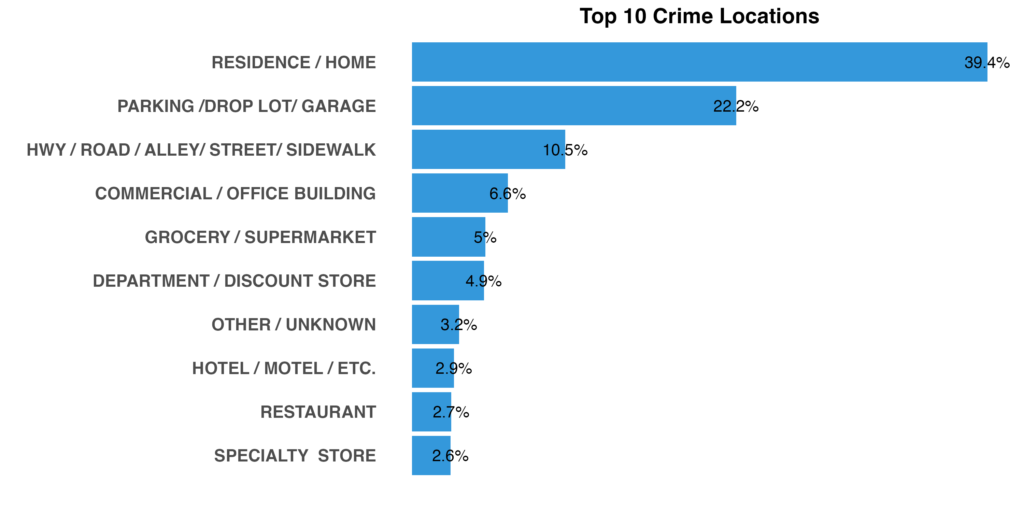
Top 10 Crime Locations
Where crimes occur matters as much as when. This chart highlights the top ten location categories where incidents are reported, from public spaces to private properties.
Recognizing these high-frequency locations provides valuable context for personal safety decisions and community planning.
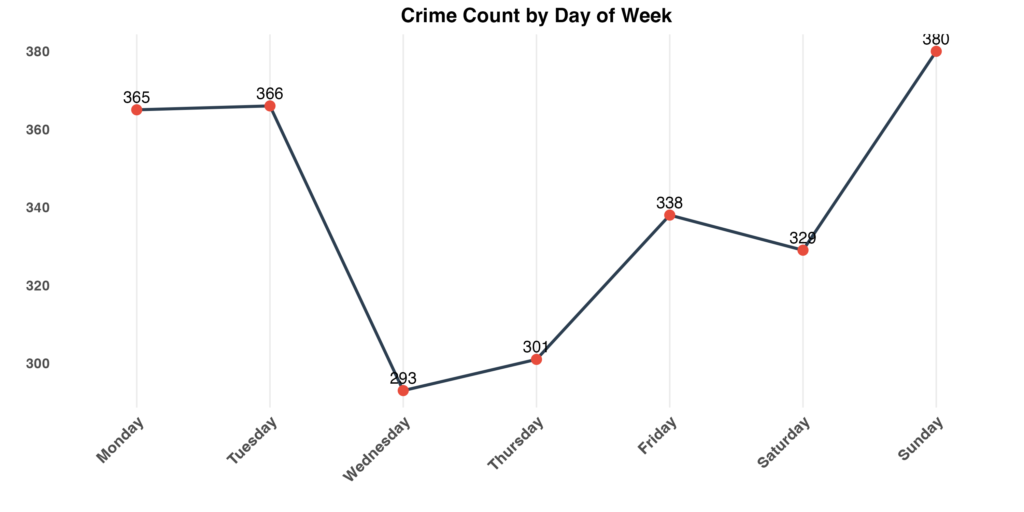
Crime Count by Day of Week
Crime patterns often vary by day of the week, with certain days showing higher activity than others. Weekend versus weekday differences may reflect changes in social behavior, business activity, and routine patterns.
Identifying these weekly trends helps reveal whether criminal activity concentrates on specific days or remains relatively consistent throughout the week.
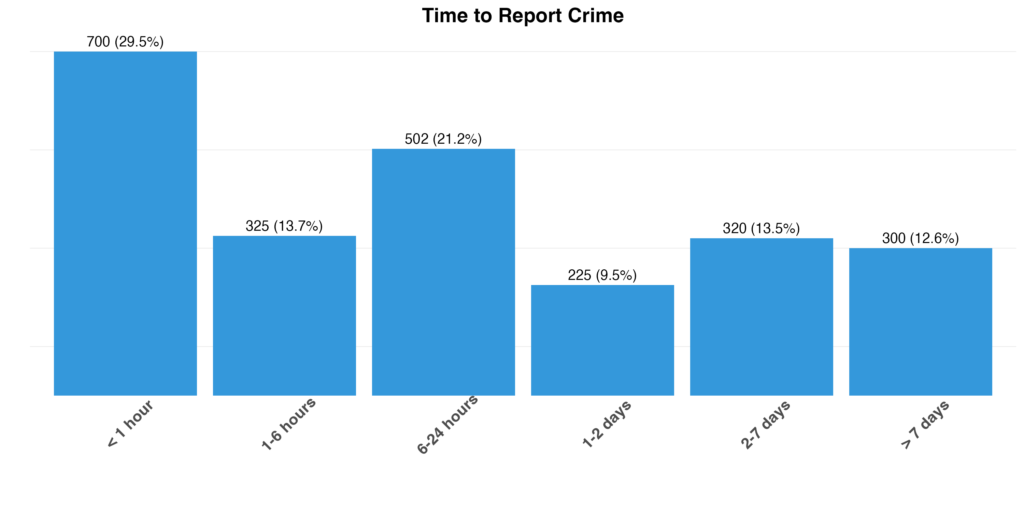
Delays: Time Between Crime Occurrence and Report
The time between when a crime occurs and when it’s reported varies significantly. Some crimes are reported immediately, while others may not be discovered or reported until hours or even days later.
These delays can reflect factors such as witness availability, crime discovery timing, victim circumstances, or the nature of the offense itself.
Crime Clearance Rates by Offense Type
Clearance rates by crime type: Auto Theft (95.1%, 253/266 cleared), Theft (88.4%, 1346/1522 cleared), Aggravated Assault (79.6%, 144/181 cleared), Burglary (73.5%, 214/291 cleared), Murder (66.7%, 2/3 cleared), Robbery (57.4%, 39/68 cleared), Rape (41.5%, 17/41 cleared).
Summary
These visualizations and statistics provide insight into crime patterns across location, time, offense type, and law enforcement response. Monthly updates reflect the latest available data from official sources.
For detailed analysis or custom reporting inquiries, contact our team via the instant chat icon or through the contact page.