Last Updated: June 10, 2026
Key Takeaways:
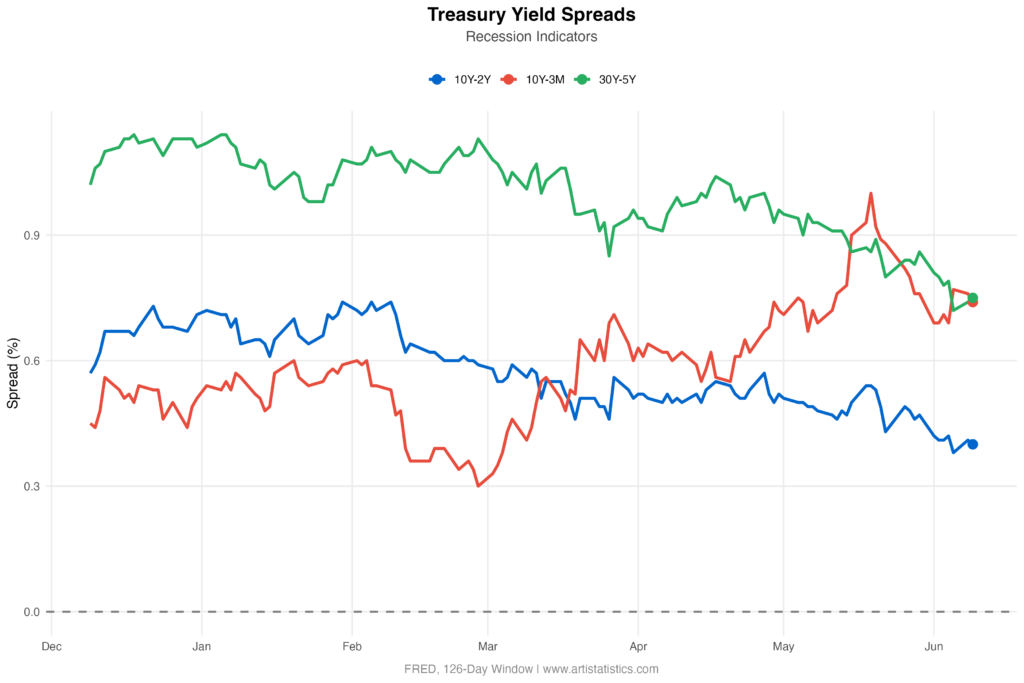
As of June 9, 2026:
- The 10-Year minus 2-Year Treasury Spread from FRED stands at 0.4% (Low) – Higher than only 3.01% of the past 126 reported values, with Normal Day-to-Day Movement of -0.01 basis points (-2.44%) from the previous reported value.
- The 10-Year minus 3-Month Treasury Spread from FRED stands at 0.74% (High) – Higher than 87.08% of the past 126 reported values, with Normal Day-to-Day Movement of -0.02 basis points (-2.63%) from the previous reported value.
- The 30-Year minus 5-Year Treasury Spread from FRED stands at 0.75% (Extremely Low) – Higher than only 0.64% of the past 126 reported values, with Normal Day-to-Day Movement of 0.01 basis points (+1.35%) from the previous reported value.
This report tracks the latest Treasury Yield Spreads from FRED, key indicators of recession risk and economic expectations. Updated daily with the most recent 126 observations for each spread, Z-score analysis measures how current spread levels and day-to-day changes compare to recent patterns, providing statistical context for understanding yield curve dynamics and potential economic turning points.
Custom Research and Analysis: Need a specialized evaluation or help interpreting specific datasets? We provide professional statistical analysis and custom reporting tailored to your requirements. Contact us to request a custom report.