Last updated: March 12, 2026
Report for February 2026
Key Takeaway
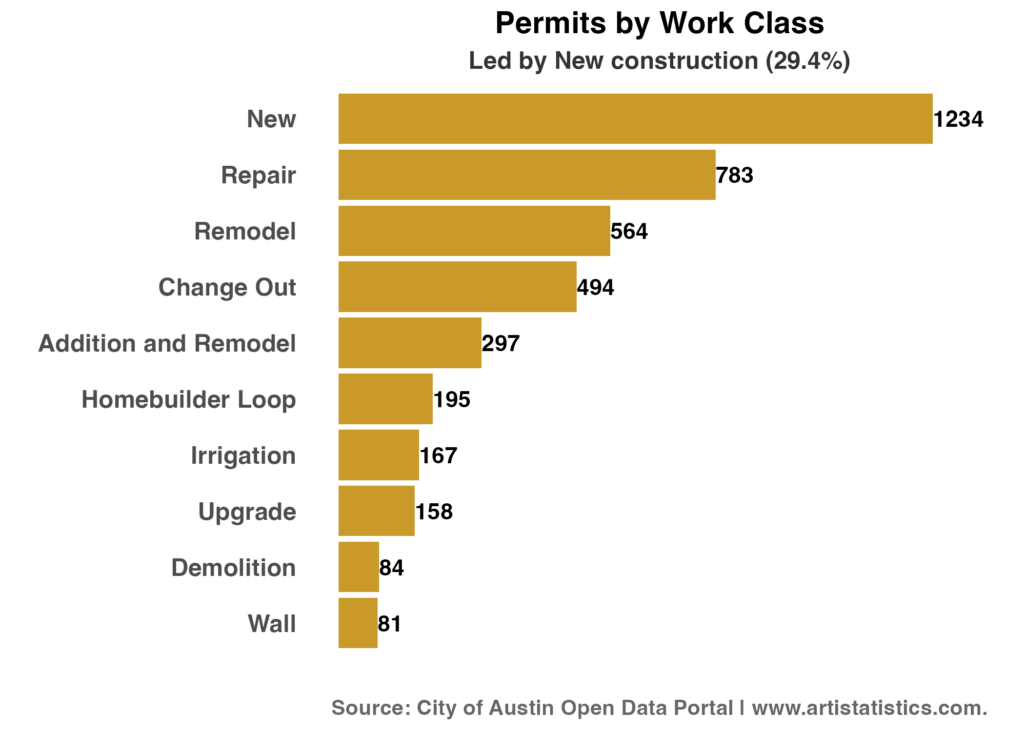
In February 2026, Austin issued 4197 construction permits, down 0.7% from the previous month (4225). 73.1% were residential (3068) and 26.9% commercial (1129). Projects classified under ‘New construction’ were the most common at 29.4% (1234 permits). Median processing time stood at 37 days, compared to 45 days the previous month (down 8 days).
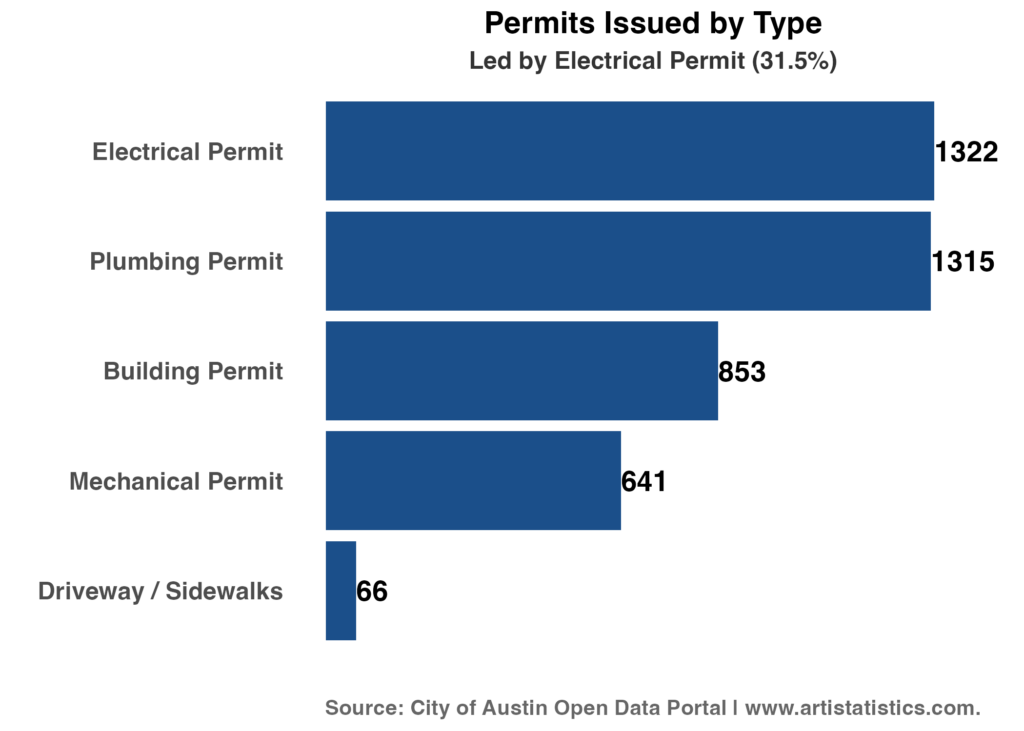
Permits are categorized by the type of work being authorized. The distribution of permit types gives a sense of what kind of work is driving activity in the city any given month.
Work class provides a finer description of what is actually being done on a property. This breakdown helps understand the nature of construction and improvement activity across the city in a given month.
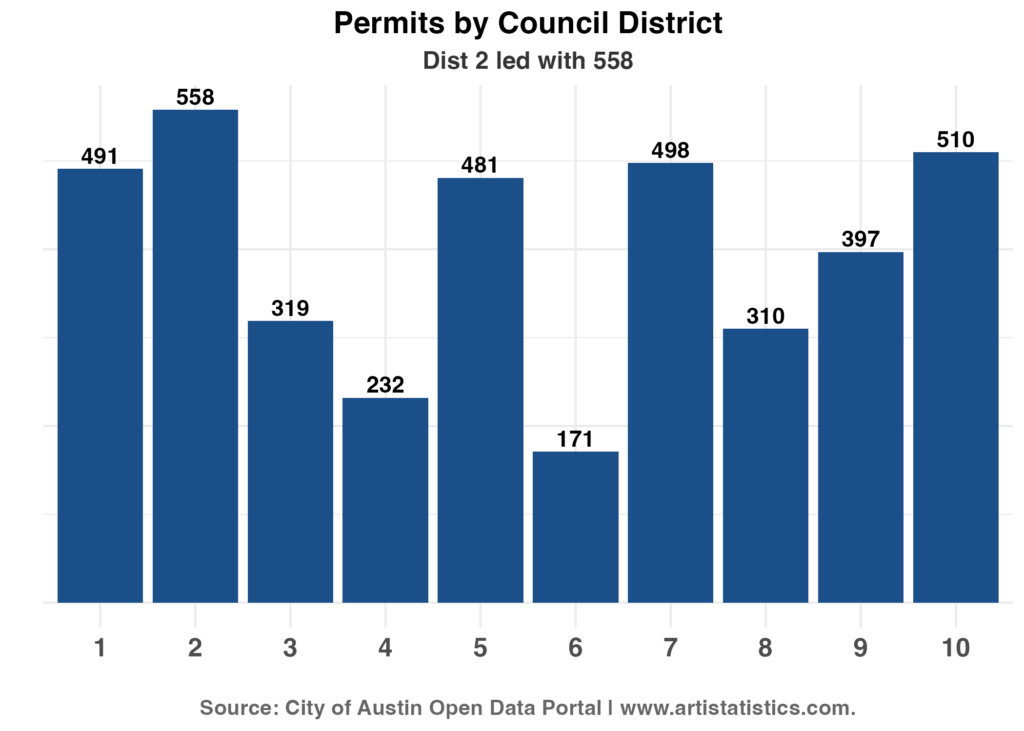
Austin is divided into 10 council districts, each representing a distinct geographic area of the city. This chart shows how permit activity is distributed across those districts each month.
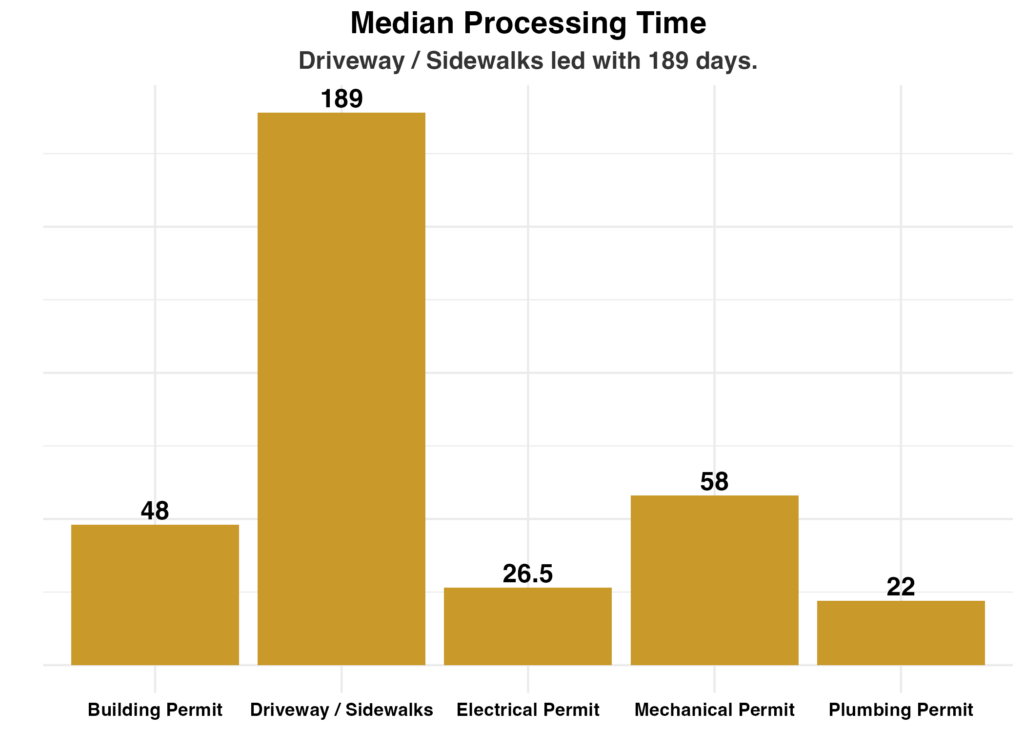
From the moment a permit application is submitted to the day it is officially issued, time matters to builders, contractors, and homeowners alike. This chart shows the median number of days that process takes, broken down by permit type.
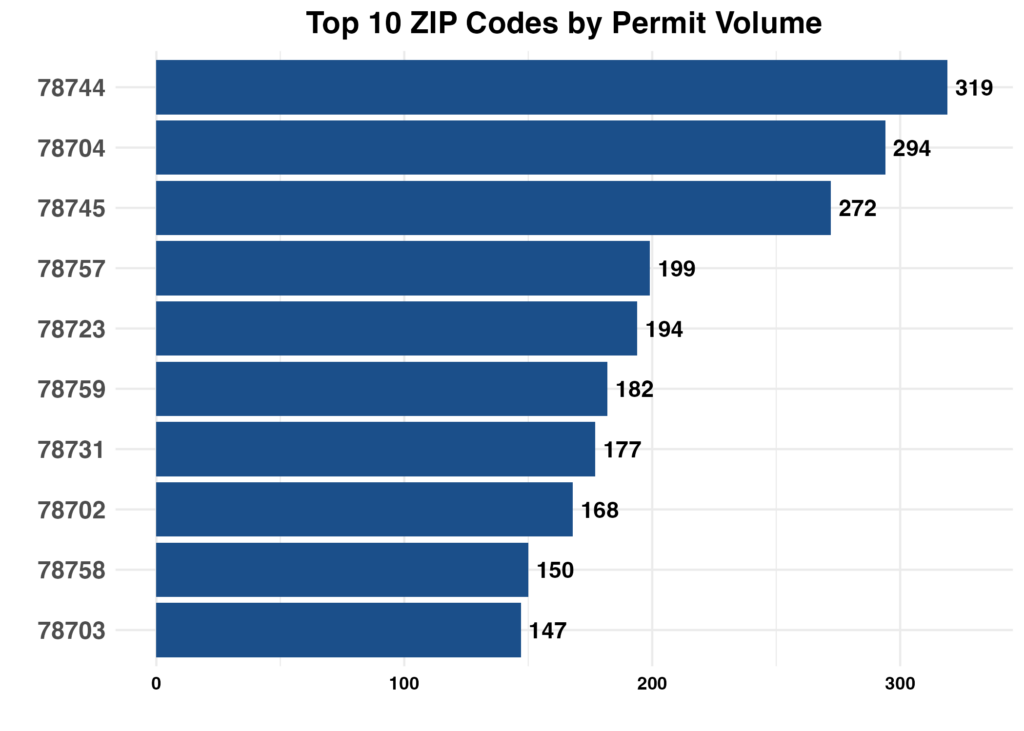
At the neighborhood level, ZIP codes reveal where construction and improvement activity is physically concentrated. This chart identifies the most active pockets of development in Austin for the month.
Custom Research and Analysis: Need a specialized evaluation or help interpreting specific datasets? We provide professional statistical analysis and custom reporting tailored to your requirements. Contact us to request a custom report.