Last Updated: January 27, 2026.
Key Takeaway: As of January 26, 2026, U.S. national average gas prices are very low, compared to the prices over the past 52 weeks. The energy market remains shifting from typical patterns based on this indicator.
Overview
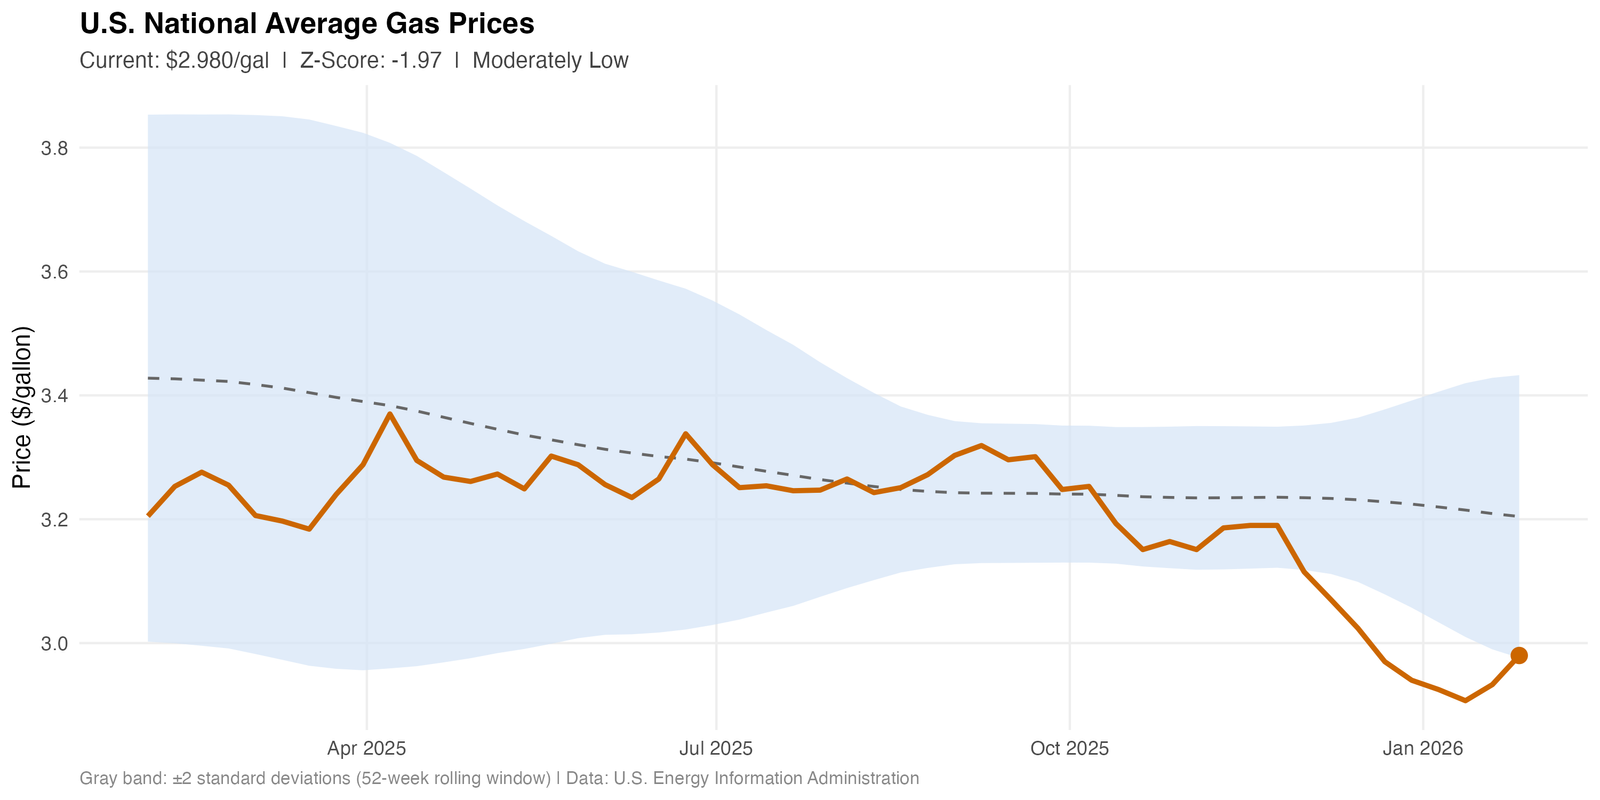
This report evaluates U.S. national average retail gasoline prices as of January 26, 2026, using weekly data from the Energy Information Administration (EIA). Rolling 52-week statistical benchmarks are applied to both price levels and week-over-week changes to distinguish structural price trends from short-term volatility. Z-score analysis is used to identify when current values deviate meaningfully from recent historical patterns.
Weekly Analysis
The national average gas price for the week ending January 26, 2026 is $2.980 per gallon. The level Z-score is -1.97 (Very Low, 2.5th percentile). The delta Z-score is +1.41 (Moderate Increase). Week-over-week change: +$0.05 per gallon.
Statistical Interpretation: Current prices are 1.97 standard deviations below the 52-week mean, placing them at the 2.5th percentile of recent observations. The series is continuing to diverge from its long-run average, though still within historically common bounds. This week’s change of +1.41 standard deviations is moderately elevated for weekly movements. Prices remain consistent with recent trends.
Custom Research and Analysis: Need a specialized evaluation or help interpreting specific datasets? We provide professional statistical analysis and custom reporting tailored to your requirements. Contact us to request a custom report.