Last Updated: June 10, 2026
Key Takeaway
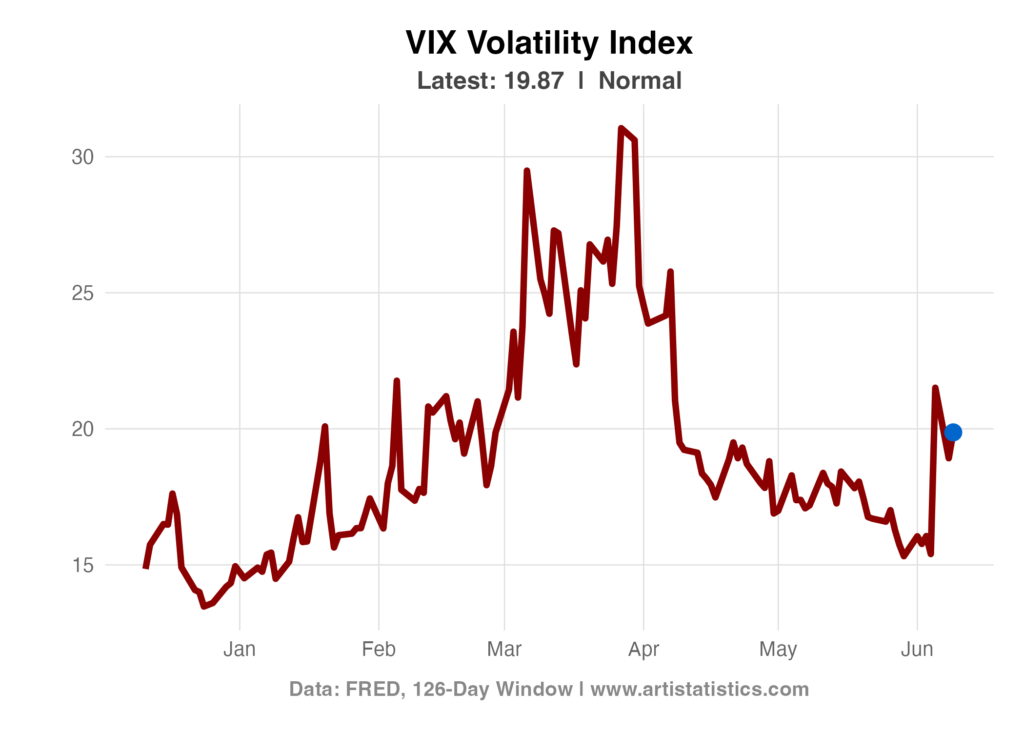
As of June 9, 2026, the VIX Volatility Index stands at 19.87 (Normal) – Higher than 58.32% of the past 126 reported values, with Normal Day-to-Day Movement of 0.95 points (+5.02%) from the previous reported value.
This report tracks the latest VIX Volatility Index, a key measure of market fear and expected stock market volatility. Updated regularly with the most recent observations, Z-score analysis measures how the current VIX level and period-to-period change compare to recent patterns, providing statistical context for understanding market sentiment and risk dynamics.
See related reports
S&P 500 Index – 30-Year Mortgage Rates – Initial Jobless Claims
Custom Research and Analysis: Need a specialized evaluation or help interpreting specific datasets? We provide professional statistical analysis and custom reporting tailored to your requirements. Contact us to request a custom report.